Fig. A.1
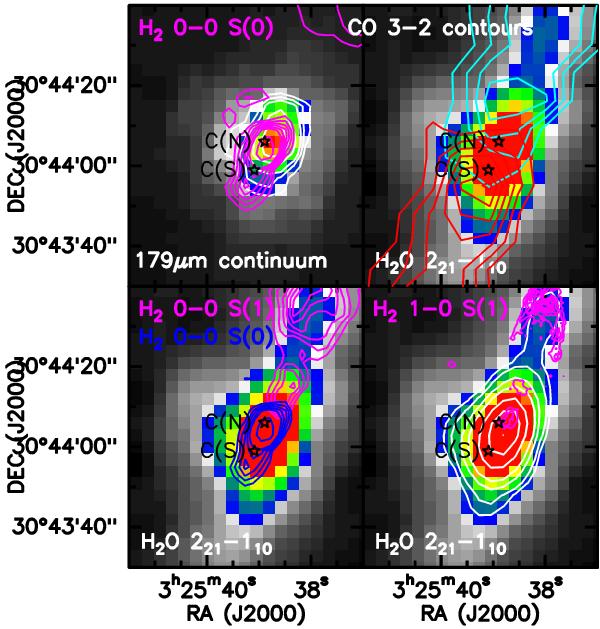
Maps of the 179 μm line and continuum emission in the region around L1448-C sources, compared with CO(3–2) and H2 lines at different excitation, namely the 0–0 S(0)(28 μm), 0–0 S(1)(17 μm), and 1–0 S(1)(2.12 μm). White contours, shown in the bottom right and upper left panels, for the line and continuum emission respectively, are drawn at the following values: 1.5, 2.0, 3.0, 4.0, 6.0 8.0 × 10⁻⁵ erg s-1 cm-2 sr-1 for the line emission, and 0.6, 0.8, 1.2, 1.6 × 10⁻³ erg s-1 cm-2 sr-1 for the continuum emission.
Current usage metrics show cumulative count of Article Views (full-text article views including HTML views, PDF and ePub downloads, according to the available data) and Abstracts Views on Vision4Press platform.
Data correspond to usage on the plateform after 2015. The current usage metrics is available 48-96 hours after online publication and is updated daily on week days.
Initial download of the metrics may take a while.