Fig. 7
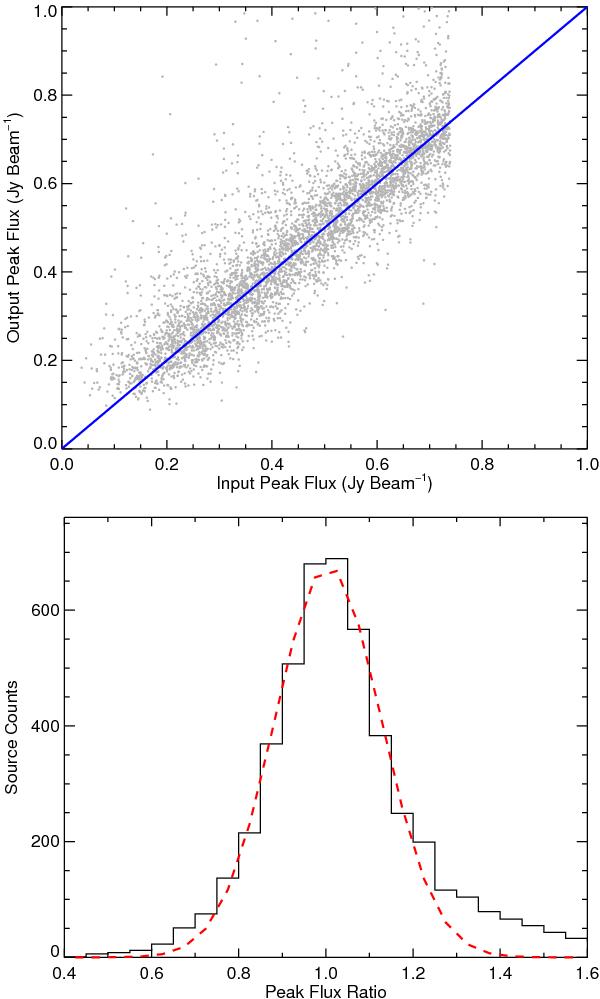
Upper panel: comparison of the recovered values for the peak fluxes values to the input values of the injected sources on the maps with varying background. The blue line represents equality. Lower panel: recovered to injected flux ratio (black histogram) and results of a Gaussian fit to values less than 1.2 (dashed red line).
Current usage metrics show cumulative count of Article Views (full-text article views including HTML views, PDF and ePub downloads, according to the available data) and Abstracts Views on Vision4Press platform.
Data correspond to usage on the plateform after 2015. The current usage metrics is available 48-96 hours after online publication and is updated daily on week days.
Initial download of the metrics may take a while.