Free Access
Fig. 6
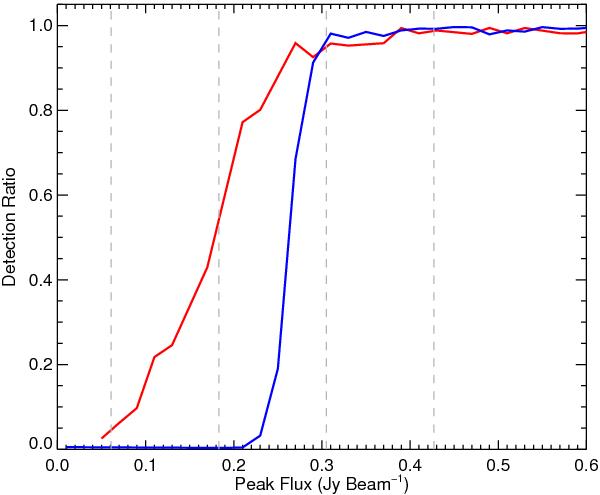
Detection ratio of recovered to injected sources as a function of input peak fluxes. The blue solid and red dashed lines show the detection ratios for sources injected onto a uniform and varying background noise map, respectively. The dashed vertical lines indicate (from left to right) the 1σ, 3σ, 5σ, and 7σ noise levels.
Current usage metrics show cumulative count of Article Views (full-text article views including HTML views, PDF and ePub downloads, according to the available data) and Abstracts Views on Vision4Press platform.
Data correspond to usage on the plateform after 2015. The current usage metrics is available 48-96 hours after online publication and is updated daily on week days.
Initial download of the metrics may take a while.