Free Access
Fig. 5
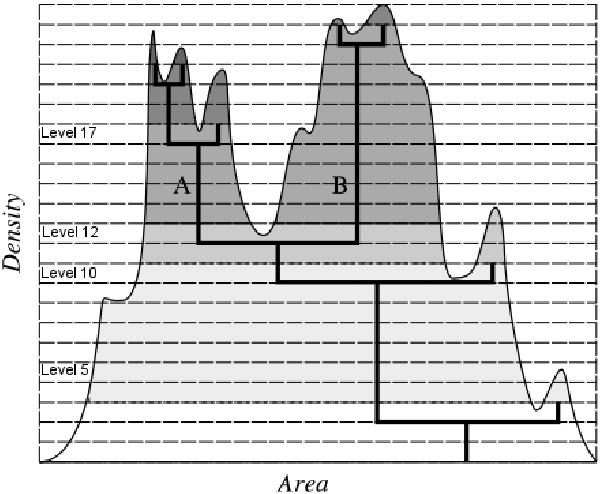
Example of the deblending process. The dependence of a pixel to one source or another will depend on the relative integrated intensities (grey area) of their adjacent pixel for each level (dotted lines). This figure has been reproduced here with permission from Bertin & Arnouts (1996).
Current usage metrics show cumulative count of Article Views (full-text article views including HTML views, PDF and ePub downloads, according to the available data) and Abstracts Views on Vision4Press platform.
Data correspond to usage on the plateform after 2015. The current usage metrics is available 48-96 hours after online publication and is updated daily on week days.
Initial download of the metrics may take a while.