Fig. 4
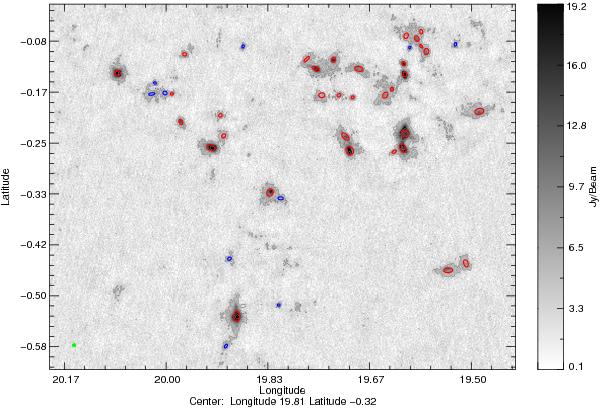
Example of the sources extracted. The field shown in greyscale is the region outlined in red in the left panel of Fig. 3. The positions and sizes of sources identified by SExtractor are shown as red and blue ellipses. The red ellipses indicate to the most reliable detections, while the blue ellipses indicated the detections associated with higher flag values, given by SExtractor, which correspond to less reliable detections (see discussion in Sect. 5.1 for details). The ATLASGAL beam size is shown in green in the lower left corner of the map. Contours start at 3σ (i.e., 0.18 Jy beam-1) and increase with steps of 0.48, 1.61, 4.32, 8.96, 15.89 Jy beam-1.
Current usage metrics show cumulative count of Article Views (full-text article views including HTML views, PDF and ePub downloads, according to the available data) and Abstracts Views on Vision4Press platform.
Data correspond to usage on the plateform after 2015. The current usage metrics is available 48-96 hours after online publication and is updated daily on week days.
Initial download of the metrics may take a while.