Fig. 2
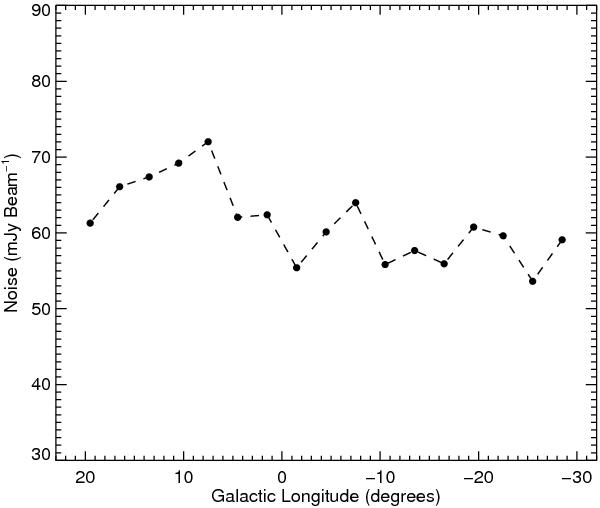
Plot showing how the noise varies as a function of Galactic longitude. The points show the standard deviation of the pixel to pixel variation averaged for each 3° × 3° field, however, we have only included pixels with |b| < 1° where the noise is relatively uniform and where the vast majority of the 870 μm emission is concentrated. A dashed line connects the point to emphasis the field-by-field variations in the noise.
Current usage metrics show cumulative count of Article Views (full-text article views including HTML views, PDF and ePub downloads, according to the available data) and Abstracts Views on Vision4Press platform.
Data correspond to usage on the plateform after 2015. The current usage metrics is available 48-96 hours after online publication and is updated daily on week days.
Initial download of the metrics may take a while.