Free Access
Fig. 15
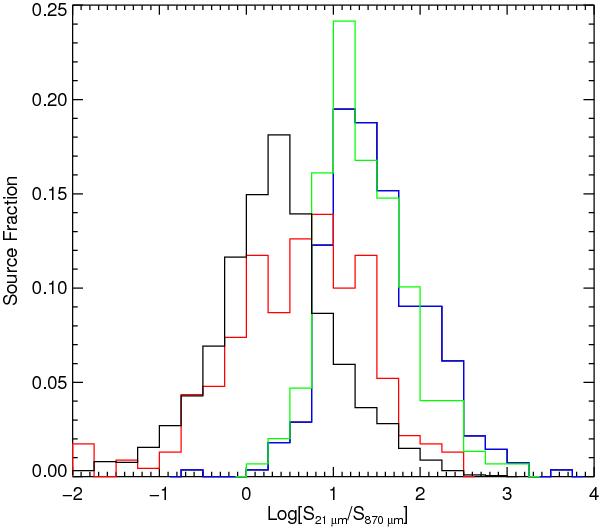
Histogram plots showing the distribution of MSX 21 μm over ATLASGAL 870 μm flux ratio for whole ATLASGAL catalogue (black), the methanol masers identified by the MMB survey (red) and UCHii regions and YSOs identified by the RMS survey (coloured blue and green, respectively).
Current usage metrics show cumulative count of Article Views (full-text article views including HTML views, PDF and ePub downloads, according to the available data) and Abstracts Views on Vision4Press platform.
Data correspond to usage on the plateform after 2015. The current usage metrics is available 48-96 hours after online publication and is updated daily on week days.
Initial download of the metrics may take a while.