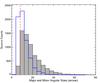
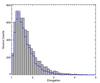
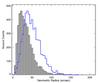
Fig. 11
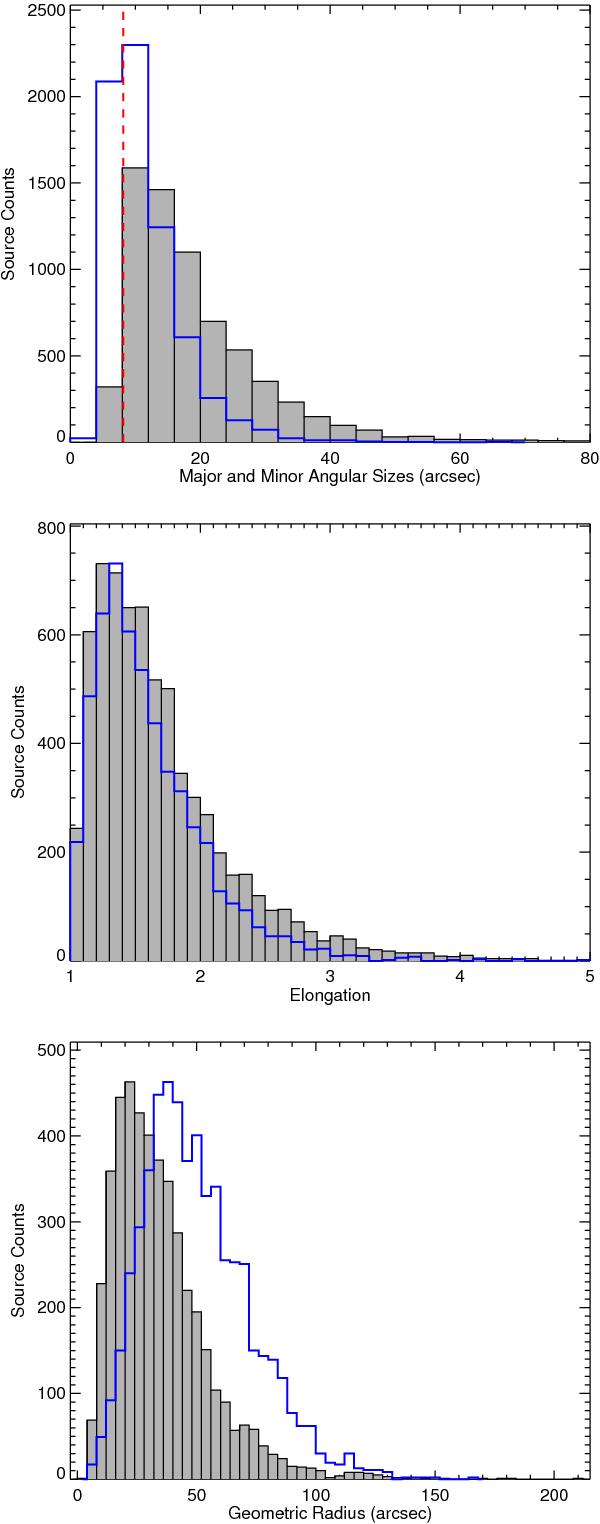
Histograms of the angular size distribution of detected ATLASGAL sources. In the upper panel we show the distribution of the semi-major (filled grey histogram) and semi-minor (blue open histogram) size distributions of detected ATLASGAL sources. The red dashed line shows the ATLASGAL rms beam size. The bin size used for both parameters is 4′′. In the middle and lower panels we present histograms of the elongation and effective radii of ATLASGAL sources (grey filled histogram) and the BGPS (blue histogram). In both cases the peak of the BGPS distribution has been normalised to the peak of the ATLASGAL distribution. The bin sizes used for the elongation and radii distributions are 0.1 and 4′′ respectively.
Current usage metrics show cumulative count of Article Views (full-text article views including HTML views, PDF and ePub downloads, according to the available data) and Abstracts Views on Vision4Press platform.
Data correspond to usage on the plateform after 2015. The current usage metrics is available 48-96 hours after online publication and is updated daily on week days.
Initial download of the metrics may take a while.