Fig. 10
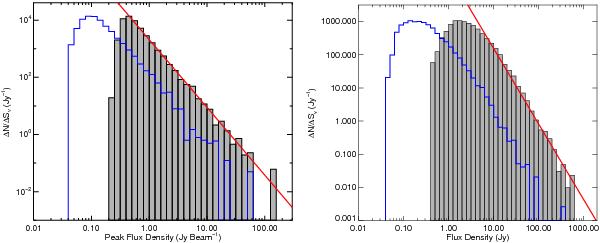
Flux density number distribution for ATLASGAL sources extracted by SExtractor (grey filled histogram) and the BGPS (blue histogram). In both plots the peak of the BGPS distribution has been normalised to the peak of the ATLASGAL distribution. In the left and right panels we present histograms of the peak and integrated flux densities measured for each source respectively. The red line on each plot shows the result of a linear least-squares fit to flux densities larger than the peak of each distribution.
Current usage metrics show cumulative count of Article Views (full-text article views including HTML views, PDF and ePub downloads, according to the available data) and Abstracts Views on Vision4Press platform.
Data correspond to usage on the plateform after 2015. The current usage metrics is available 48-96 hours after online publication and is updated daily on week days.
Initial download of the metrics may take a while.