Fig. 1
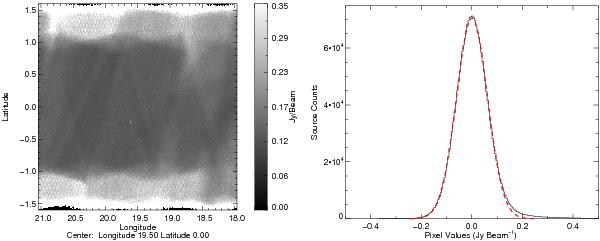
Left panel: rms noise map of a 3° × 3° field centred on ℓ = 19.5° and b = 0 showing how the noise varies as a function of Galactic longitude and latitude. Right panel: histogram of the pixel values found within | b | < 1° where the noise is approximately constant. The red line show the result of a Gaussian fit to the noise, from which we estimate the average noise for this field (σrms ≃ 60 mJy).
Current usage metrics show cumulative count of Article Views (full-text article views including HTML views, PDF and ePub downloads, according to the available data) and Abstracts Views on Vision4Press platform.
Data correspond to usage on the plateform after 2015. The current usage metrics is available 48-96 hours after online publication and is updated daily on week days.
Initial download of the metrics may take a while.