Free Access
Fig. 3
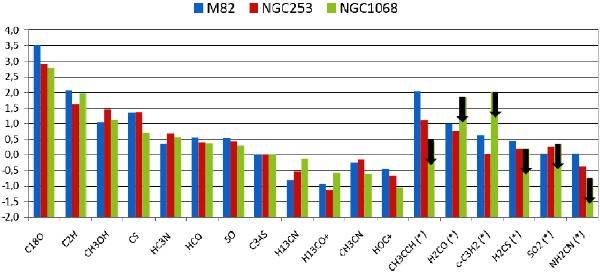
Comparison of the fractional abundances among the two starbust galaxies M 82 (blue) and NGC 253 (red), and the AGN NGC 1068 (green). Y-axis is log10(Nmol/NC34S). Molecules marked with an * were not detected in our NGC 1068 survey; arrows indicate their upper limits to the fractional abundances.
Current usage metrics show cumulative count of Article Views (full-text article views including HTML views, PDF and ePub downloads, according to the available data) and Abstracts Views on Vision4Press platform.
Data correspond to usage on the plateform after 2015. The current usage metrics is available 48-96 hours after online publication and is updated daily on week days.
Initial download of the metrics may take a while.