Fig. 1
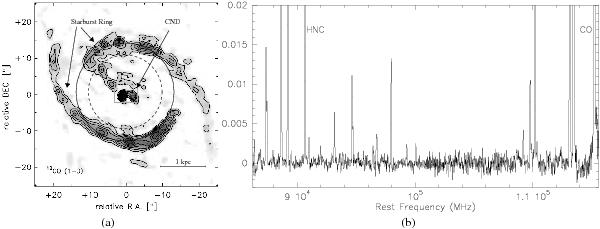
a) 12CO (1−0) map of the NGC 1068 nucleus (taken from Schinnerer et al. 2000). The beam sizes at the lowest and highest frequencies of the survey are plotted with a solid and a dotted circle respectively. The starburst ring and CND are also indicated. b) Our molecular line survey in the 3 mm wavelengths. Temperatures are in TMB(K).
Current usage metrics show cumulative count of Article Views (full-text article views including HTML views, PDF and ePub downloads, according to the available data) and Abstracts Views on Vision4Press platform.
Data correspond to usage on the plateform after 2015. The current usage metrics is available 48-96 hours after online publication and is updated daily on week days.
Initial download of the metrics may take a while.