Fig. 9
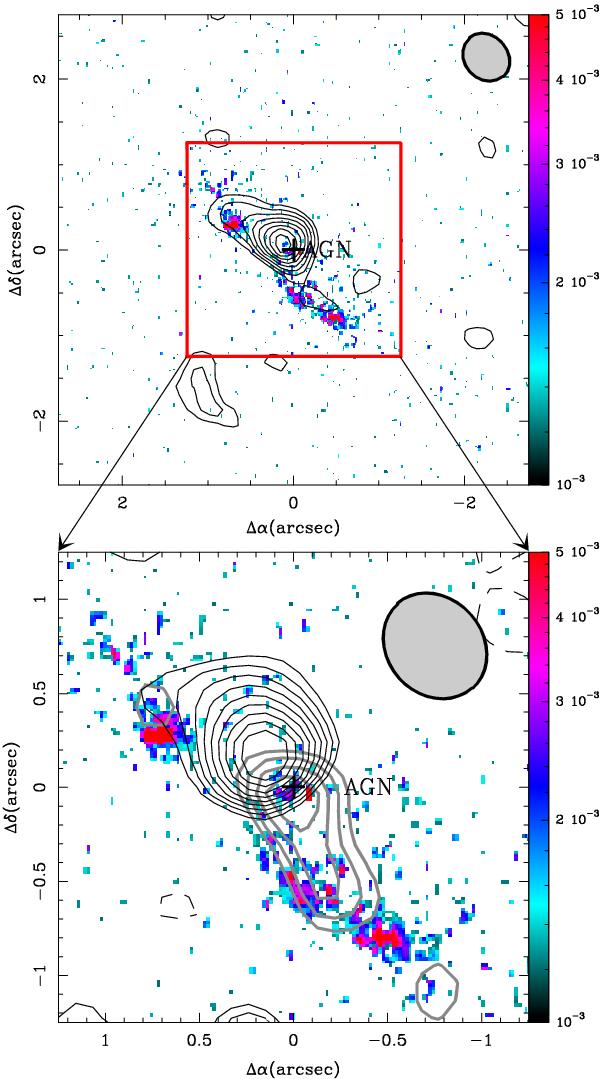
Top panel: HST FUV image of the star forming regions of 3C 236, with the integrated 12CO(2-1) emission overlaid. Bottom panel: zoom into the central 3″ of 3C 236. The contours correspond to the 12CO(2-1) emission integrated in the red (thin, black line) and blue (thick, gray line) channels. Contour levels as in Fig. 4. HST image in counts s-1. (Color version available in electronic format.)
Current usage metrics show cumulative count of Article Views (full-text article views including HTML views, PDF and ePub downloads, according to the available data) and Abstracts Views on Vision4Press platform.
Data correspond to usage on the plateform after 2015. The current usage metrics is available 48-96 hours after online publication and is updated daily on week days.
Initial download of the metrics may take a while.