Fig. 8
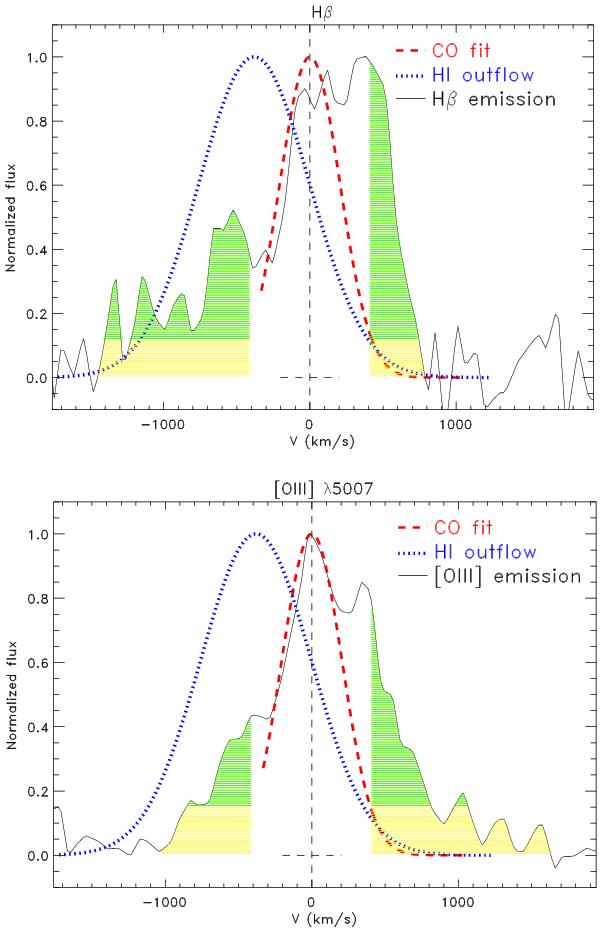
Zooms of the Hβ (top panel) and [O iii]λ5007 Å (bottom panel) emission lines (black, solid line), with the 12CO(2-1) emission (red, dashed line), and H i outflow absorption (blue, dotted line) overlaid. For comparison, all fluxes are normalized and the H i absorption is inverted. The horizontal dashed line shows the FWHM of 12CO(2-1) emission. The vertical dashed line marks the  . The shaded areas mark the emission of the optical lines beyond ± 400 km s-1, above the continuum (yellow) and 3σ (green) levels. (Color version available in electronic format.)
Current usage metrics show cumulative count of Article Views (full-text article views including HTML views, PDF and ePub downloads, according to the available data) and Abstracts Views on Vision4Press platform.
Data correspond to usage on the plateform after 2015. The current usage metrics is available 48-96 hours after online publication and is updated daily on week days.
Initial download of the metrics may take a while.