Fig. 6
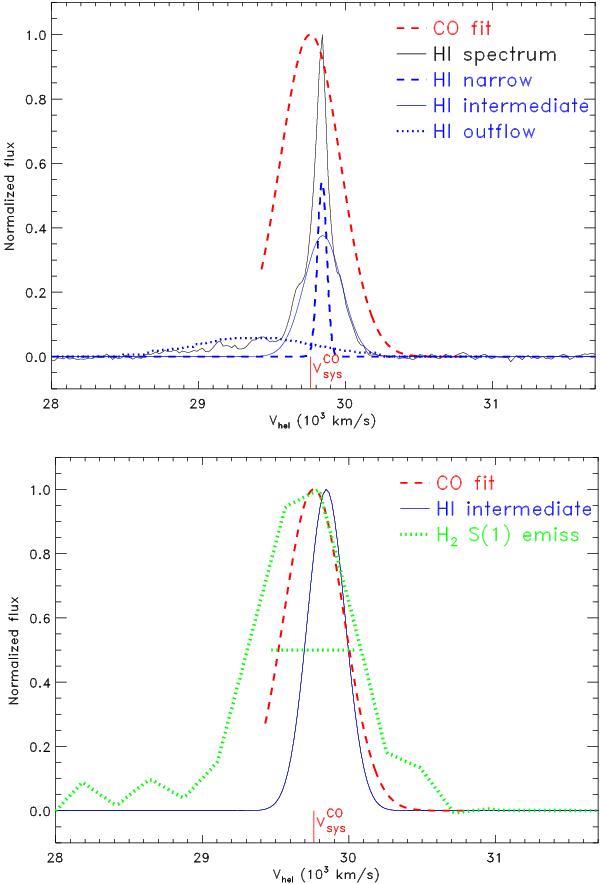
H i absorption (Morganti et al. 2005), H2 S(1) 17 μm emission (Dasyra & Combes 2011), and Gaussian fit of the 12CO(2-1) emission of 3C 236. For comparison, the spectra are normalized and the H i absorption is shown inverted. The red vertical line marks the  . Top panel: comparison of the CO emission (red, dashed line) and H i absorption. The black line shows the integrated H i absorption spectrum of 3C 236. The three components of the fit to the H i spectrum are represented with blue lines. Bottom panel: comparison of the CO emission (red, dashed line), H2 S(1) 17 μm emission (green line), and the H i intermediate width component (blue line). The horizontal green line shows the FWHM of the H2 S(1) 17 μm line, corrected for instrumental broadening.
Current usage metrics show cumulative count of Article Views (full-text article views including HTML views, PDF and ePub downloads, according to the available data) and Abstracts Views on Vision4Press platform.
Data correspond to usage on the plateform after 2015. The current usage metrics is available 48-96 hours after online publication and is updated daily on week days.
Initial download of the metrics may take a while.