Fig. 4
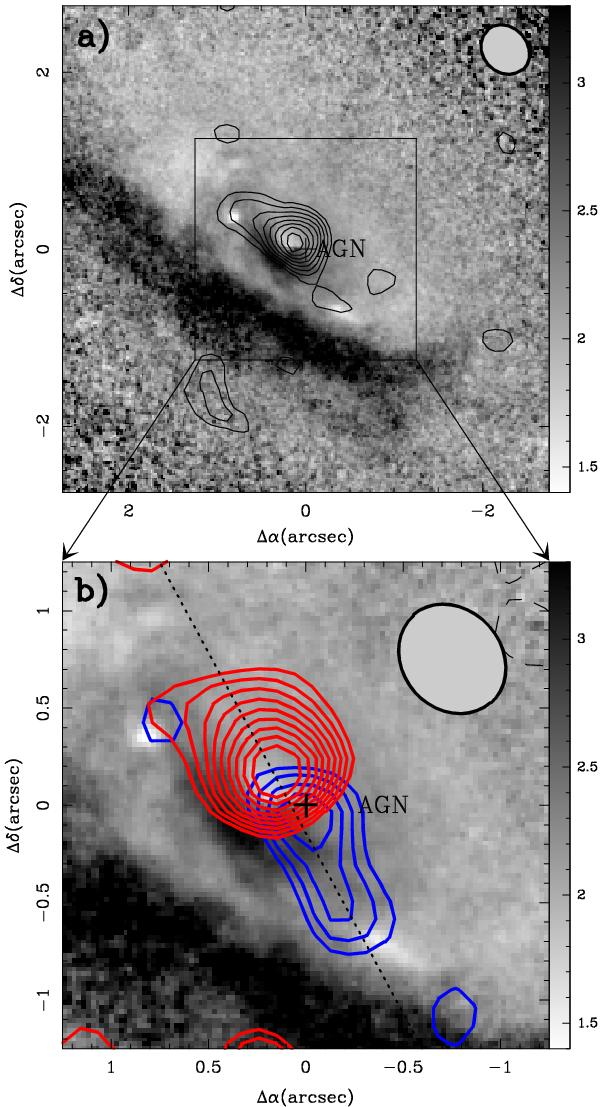
a) V–H color map (gray scale in STmag magnitude system) of 3C 236, with the integrated 12CO(2-1) emission overlaid. Contour levels as in Fig. 2. b) Zoom into the central 3″ of 3C 236. Contours represent the 12CO(2-1) line maps of 3C 236 integrated in two channels: blue ( –330 km s-1 < ν < ) and red ( < ν < + 485 km s-1). The contour levels are 3σ to 4.5σ in steps of 0.5σ (σ = 0.13 Jy beam-1 km s-1) for the blue channel, and 3σ to 7σ in steps of 0.5σ (σ = 0.13 Jy beam-1 km s-1) for the red channel. The dashed line shows the major axis of the molecular gas disk. (Δα, Δδ)-offsets in arcsec are relative to the location of the AGN. The gray ellipses show the 1 mm beam. Color version available in electronic format.
Current usage metrics show cumulative count of Article Views (full-text article views including HTML views, PDF and ePub downloads, according to the available data) and Abstracts Views on Vision4Press platform.
Data correspond to usage on the plateform after 2015. The current usage metrics is available 48-96 hours after online publication and is updated daily on week days.
Initial download of the metrics may take a while.