Fig. 3
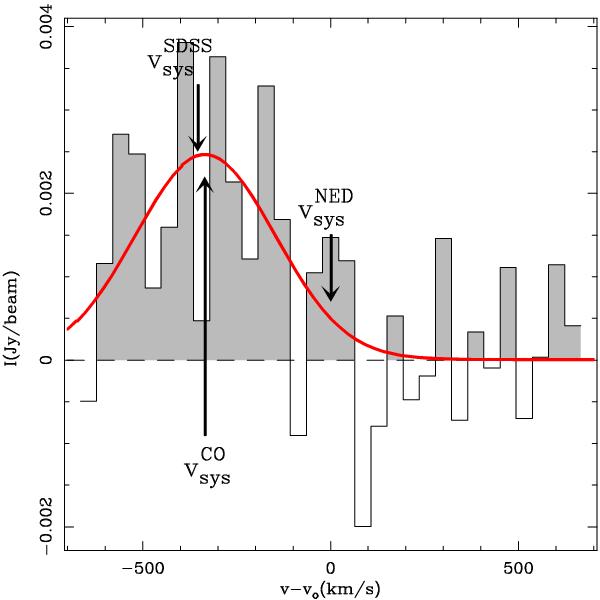
Spectrum of the 12CO(2-1) line emission (after subtracting the continuum emission) toward the AGN position of 3C 236 (histogram). The red solid line shows the Gaussian fit to the spectrum. Velocities in the x-axis are with respect to the redshift z = 0.10054 (ν0(HEL) = 30 129 km s-1), where the PdBI narrow band correlator was centered. Arrows mark the heliocentric systemic velocity of 3C 236 according to SDSS (29 740 km s-1), CO (29 761 km s-1), and NED (30 129 km s-1).
Current usage metrics show cumulative count of Article Views (full-text article views including HTML views, PDF and ePub downloads, according to the available data) and Abstracts Views on Vision4Press platform.
Data correspond to usage on the plateform after 2015. The current usage metrics is available 48-96 hours after online publication and is updated daily on week days.
Initial download of the metrics may take a while.