Free Access
Fig. A.1
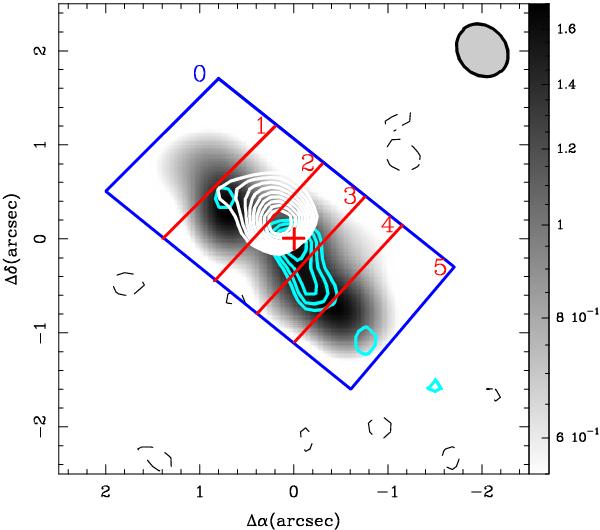
HST FUV image of the star-forming regions of 3C 236, smoothed with the beam of CO, with the red and blue 12CO(2-1) channels overlaid. Contour levels as in Fig. 4. Rectangles show the schematic location of the different regions for the analysis of the SFR and H2 distribution. (Color version available in electronic format.)
Current usage metrics show cumulative count of Article Views (full-text article views including HTML views, PDF and ePub downloads, according to the available data) and Abstracts Views on Vision4Press platform.
Data correspond to usage on the plateform after 2015. The current usage metrics is available 48-96 hours after online publication and is updated daily on week days.
Initial download of the metrics may take a while.