Fig. 7
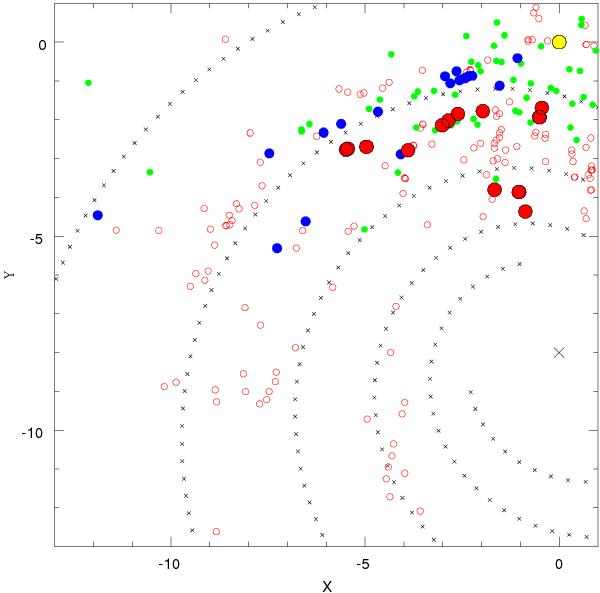
Comparison of the observations to the Vallée (2008) model with four arms in the fourth quadrant of the Galaxy. We assumed a distance to the Galactic Centre of R0 = 8.0 kpc. Cepheid distances (Majaess et al. 2009) are plotted as green points, open clusters and young groups from optical (UBVI) data (from several studies) are plotted as blue points, while red filled points show near-IR clusters studied using VVV data (Paper I, this study and Baume et al. 2010). Open red circles mark the Hii tracers (Hou et al. 2009) and the yellow dot marks the position of the Sun.
Current usage metrics show cumulative count of Article Views (full-text article views including HTML views, PDF and ePub downloads, according to the available data) and Abstracts Views on Vision4Press platform.
Data correspond to usage on the plateform after 2015. The current usage metrics is available 48-96 hours after online publication and is updated daily on week days.
Initial download of the metrics may take a while.