Fig. 5
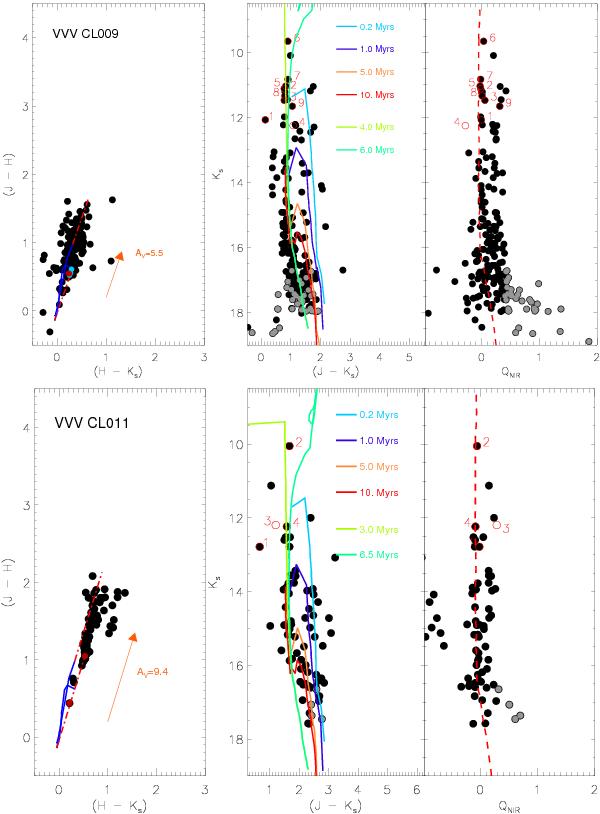
For each cluster we present a series of three diagrams. Left: (H − Ks) vs. (J − H). The Koornneef et al. (1983) and Schmidt-Kaler (1982) models for luminosity classes I and V, respectively, are plotted in blue. The O and B stars are plotted as small blue and red points, respectively and the reddening vector indicates the measured value of AV. Middle: (J − Ks) vs. Ks. Spectroscopic targets are marked using red circles, but those with magnitudes or colours outside the figure boundaries are listed on the plot. The PMS isochrones are shown in light blue (0.2 Myr), dark blue (1.0 Myr), orange (5.0 Myr) and red (10 Myr), while the two upper and lower limits of fitted MS isochrones are shown in light and dark green. Right: QNIR = (J − H) − 2.14(H − Ks) vs Ks. Spectroscopic targets are also marked. A 5 Myr MS isochrone is plotted using a dashed red line and the PMS stars are plotted as grey points.
Current usage metrics show cumulative count of Article Views (full-text article views including HTML views, PDF and ePub downloads, according to the available data) and Abstracts Views on Vision4Press platform.
Data correspond to usage on the plateform after 2015. The current usage metrics is available 48-96 hours after online publication and is updated daily on week days.
Initial download of the metrics may take a while.