Free Access
Fig. 4
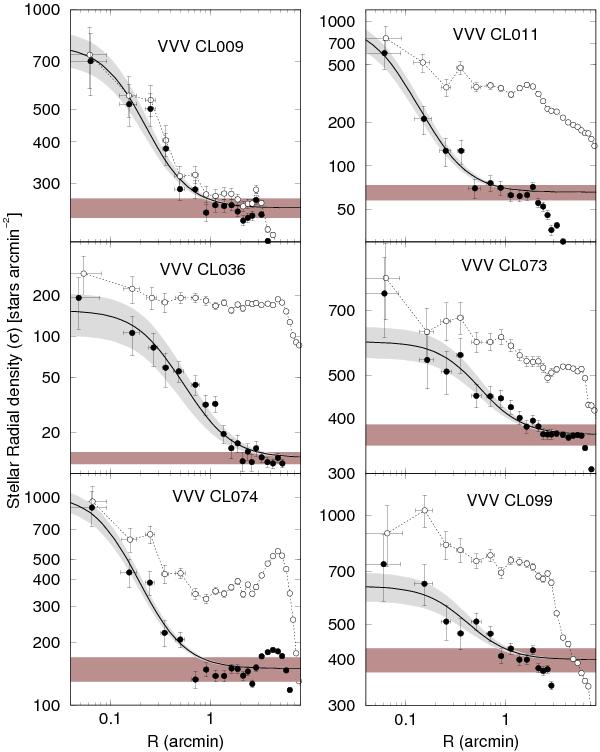
RDPs of the six clusters. The open circles show the RDPs obtained from the complete catalogue, while the black points are based on the filtered catalogue. The red horizontal band represents the background level (the width is determined by the uncertainty on the value) and King profiles are given with uncertainties in grey.
Current usage metrics show cumulative count of Article Views (full-text article views including HTML views, PDF and ePub downloads, according to the available data) and Abstracts Views on Vision4Press platform.
Data correspond to usage on the plateform after 2015. The current usage metrics is available 48-96 hours after online publication and is updated daily on week days.
Initial download of the metrics may take a while.