Fig. 3
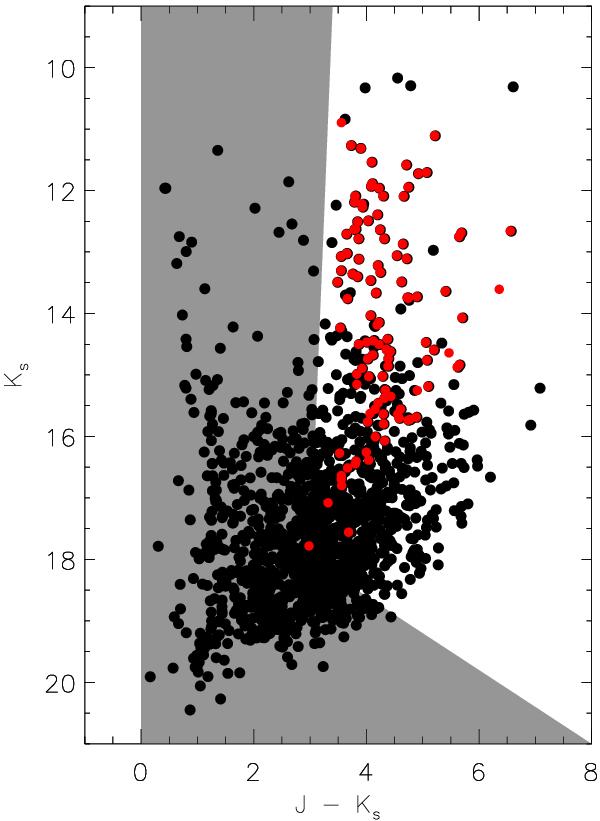
(J − Ks) colour as a function of Ks for VVV CL074 based on the complete photometric catalogue (black points). Only stars within a radius of 0.7′ around the central position of the cluster are plotted. This radius was derived from the RDP calculated from the complete catalogue. The red dots represent the same CMD, but based only on the decontaminated catalogue. The stars in the grey area are undoubtedly not part of the cluster and can be removed from the catalogue without any loss of information before recalculating the RDP. Once a new and refined cluster radius has been determined from the RDP obtained from the filtered catalogue, a final statistical decontamination step was performed (see text).
Current usage metrics show cumulative count of Article Views (full-text article views including HTML views, PDF and ePub downloads, according to the available data) and Abstracts Views on Vision4Press platform.
Data correspond to usage on the plateform after 2015. The current usage metrics is available 48-96 hours after online publication and is updated daily on week days.
Initial download of the metrics may take a while.