Fig. 8
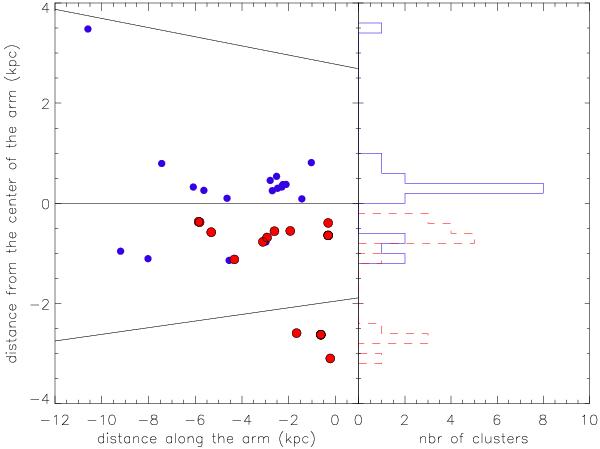
Left: distance from the centre of the Carina arm (as modelled by Vallée 2008) of the clusters shown in Fig. 7 as a function of their position along the arm. The Centaurus (over) and the Crux (under) arms are also plotted as slopes. Right: distribution of the clusters with respect to the centre of the Carina arm. The distribution of the clusters from optical data is plotted in blue, and the distribution of the clusters studied using VVV is plotted in red.
Current usage metrics show cumulative count of Article Views (full-text article views including HTML views, PDF and ePub downloads, according to the available data) and Abstracts Views on Vision4Press platform.
Data correspond to usage on the plateform after 2015. The current usage metrics is available 48-96 hours after online publication and is updated daily on week days.
Initial download of the metrics may take a while.