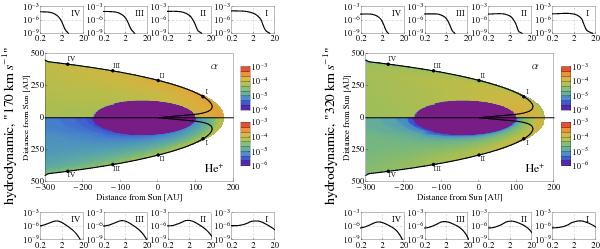
Fig. 6

Calculated heliosheath energetic He-ion density distributions and energy spectra for the frontal part of heliosphere (in the hydrodynamic model). Injection data in left panel correspond to “170 km s-1”, right panel to “320 km s-1”. Other details similar to Fig. 5, except that the flow line shown starts at a TS point 15° away from the apex.
Current usage metrics show cumulative count of Article Views (full-text article views including HTML views, PDF and ePub downloads, according to the available data) and Abstracts Views on Vision4Press platform.
Data correspond to usage on the plateform after 2015. The current usage metrics is available 48-96 hours after online publication and is updated daily on week days.
Initial download of the metrics may take a while.


