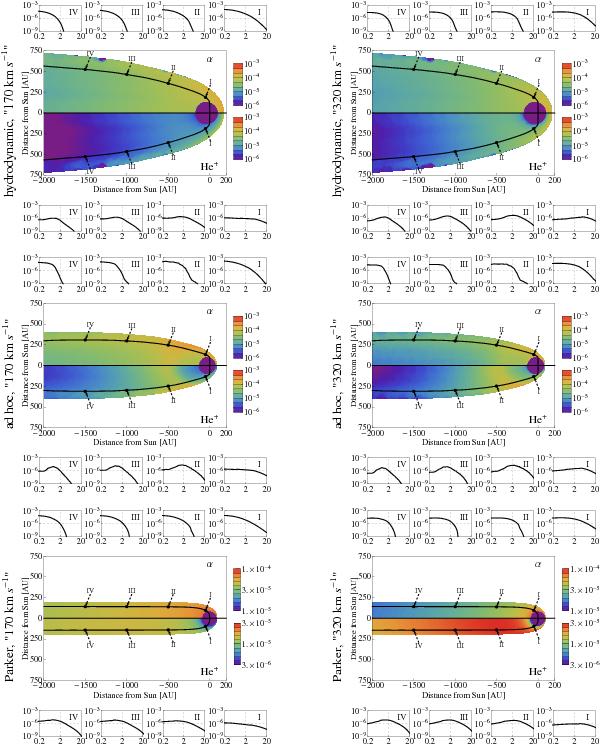
Fig. 5

Calculated density distributions and energy spectra of heliosheath energetic He ions for the hydrodynamic, Parker, and ad hoc models. Upper/middle/lower rows correspond to hydrodynamic/ad hoc/Parker models. Left column of the panels corresponds to the peak velocity of the initial kappa-distributions of α-particles injected at TS equal to 170 km s-1; right column, correspondingly, to 320 km s-1. He+ injection as described in the text. In a given row, the upper (lower) half of each heliosphere map represents density distribution of α-particles (He+ ions). Distance scale is in AU. Density scales (equal for α-particles and He+ ions only in the two upper rows) are indicated on vertical strips on the right side of each half-heliosphere map. Small panels placed above (below) maps illustrate the evolution of energy spectra of α-particles (He+ ions) as the background plasma parcel is carried over points I, II, III, IV along the flow line. The line starting at the TS point 90° away from the apex is shown. Horizontal (vertical) axis in small panels describes ion energy in keV (ion density in cm-3 keV-1).
Current usage metrics show cumulative count of Article Views (full-text article views including HTML views, PDF and ePub downloads, according to the available data) and Abstracts Views on Vision4Press platform.
Data correspond to usage on the plateform after 2015. The current usage metrics is available 48-96 hours after online publication and is updated daily on week days.
Initial download of the metrics may take a while.


