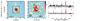
Fig. 7
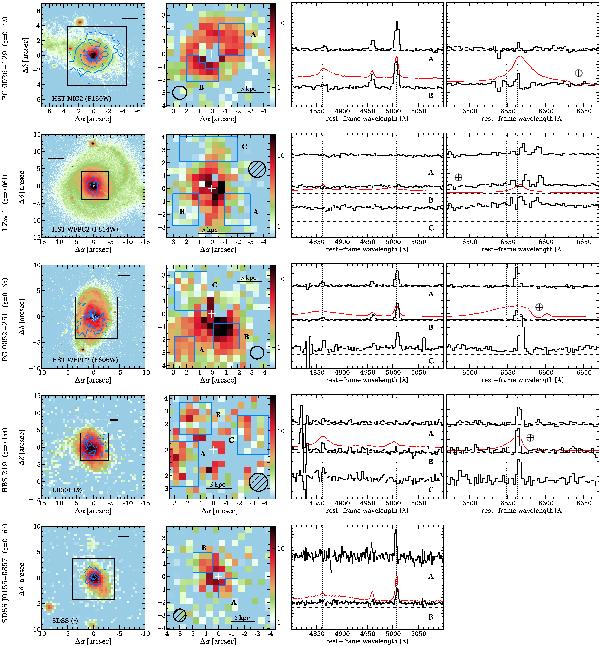
Overview of the individual objects with extended emission after the point-like emission of the QSO was subtracted. Left panels: nucleus-subtracted broad-band images with overplotted contours of extended line emission within the PMAS FoV (black box). A scale bar represents 5 kpc at the object redshift and the image is oriented such that North is up and East is to the left. Middle panels: nucleus-subtracted [O iii] narrow-band PMAS images with a logarithmic scaling in units of 10-16 erg s-1 cm-2 arcsec-2. Note that in the case of I Zw 1, RBS 219 and PHL 1811, the Hα narrow-band images are shown instead. The blue boundaries indicate the spatial regions defined to obtain the co-added spectra shown in the right panels. A white cross marks the position of the QSO and the black ellipse indicates the FWHM of the PSF. Right panels: co-added spectra of the specific spatial regions around the Hβ and Hα line, if it was covered by the spectral range of the used instrument setup. The different spectra are arbitrarily scaled and offset from each other, for which the dashed lines indicate their corresponding zero flux density. Vertical dotted lines mark the position of emission lines at the QSO redshift, estimated from the peak of the narrow [O iii] line or from the peak of the Hβ line when the [O iii] line was too weak or exceptionally broad. The arbitrarily scaled QSO spectrum is shown as a red line for comparison. Telluric absorption line features are highlighted by a crossed circle symbol.

Current usage metrics show cumulative count of Article Views (full-text article views including HTML views, PDF and ePub downloads, according to the available data) and Abstracts Views on Vision4Press platform.
Data correspond to usage on the plateform after 2015. The current usage metrics is available 48-96 hours after online publication and is updated daily on week days.
Initial download of the metrics may take a while.