Fig. 6
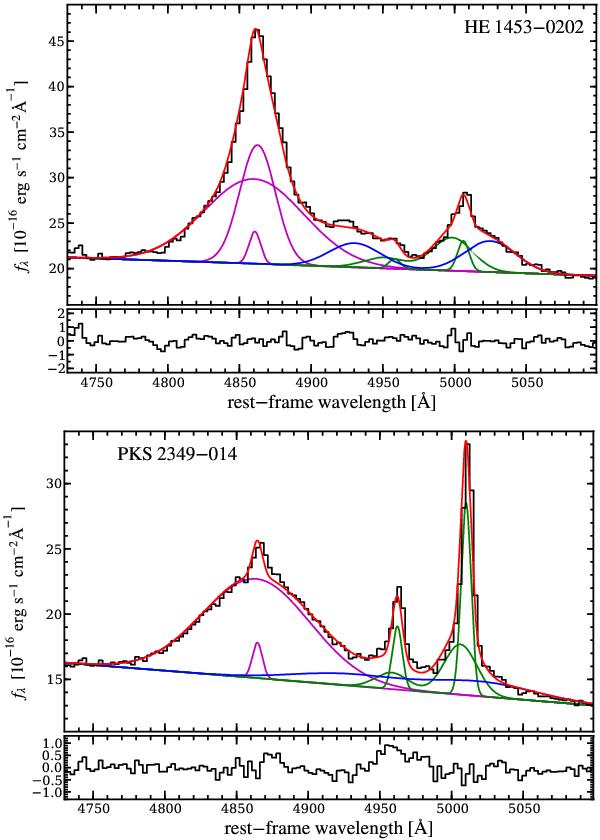
Spectral modelling of the Hβ–[O iii] region for two representative QSO spectra. The black line correspond to the observed QSO spectra and the red curve represents our best fit model. The model consists of individual Gaussian components for the emission lines (Hβ–magenta, [O iii]–green, Fe ii–blue) above a straight line for the local continuum. The residual of the model are shown in a dedicated panel below.
Current usage metrics show cumulative count of Article Views (full-text article views including HTML views, PDF and ePub downloads, according to the available data) and Abstracts Views on Vision4Press platform.
Data correspond to usage on the plateform after 2015. The current usage metrics is available 48-96 hours after online publication and is updated daily on week days.
Initial download of the metrics may take a while.