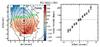
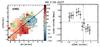
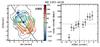
Fig. 18
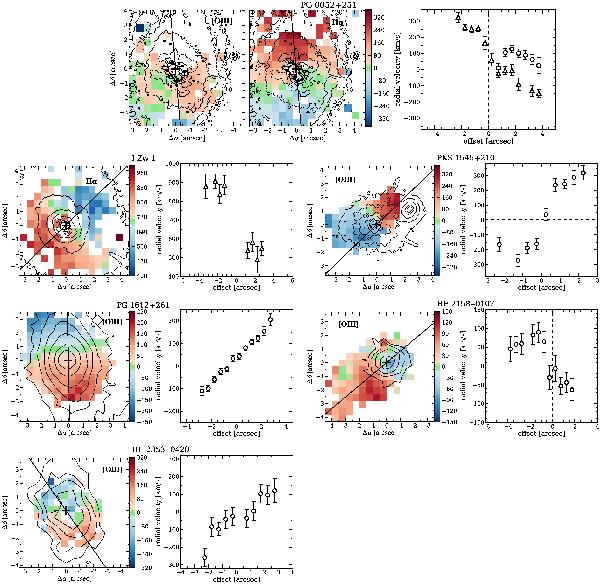
2D velocity maps for objects with apparently large-scale rotational motion gas motion. The continuum light distribution of broad-band images are overplotted as thin solid black contours for comparison. A “longslit” velocity curves along the apparent major kinematic axis is extracted from the maps as described in the text. A thick solid black line indicates the orientation of the major kinematic axis. The radial velocity are estimated for each spaxel by modelling the corresponding emission line with a Gaussian profile. The vertical dashed line highlights the position of the QSO along the synthetic slit and the horizontal dashed line indicates the measured velocity zero-point of the velocity curve.
Current usage metrics show cumulative count of Article Views (full-text article views including HTML views, PDF and ePub downloads, according to the available data) and Abstracts Views on Vision4Press platform.
Data correspond to usage on the plateform after 2015. The current usage metrics is available 48-96 hours after online publication and is updated daily on week days.
Initial download of the metrics may take a while.