Fig. 11
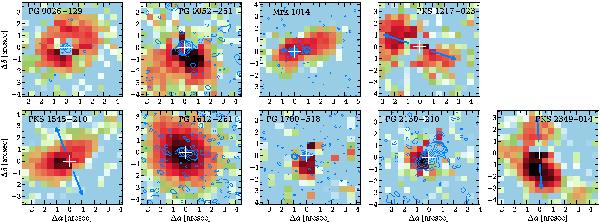
The nucleus-subtracted ENLR light distribution of the [O iii] line in comparison to the resolved radio emission. For the RQQs the high spatial resolution VLA radio images are overplotted as blue contours, while the primary radio axis of the radio lobes in RLQs is indicated by the blue arrows. The white cross marks the position of the QSO on which the radio emission is centred.
Current usage metrics show cumulative count of Article Views (full-text article views including HTML views, PDF and ePub downloads, according to the available data) and Abstracts Views on Vision4Press platform.
Data correspond to usage on the plateform after 2015. The current usage metrics is available 48-96 hours after online publication and is updated daily on week days.
Initial download of the metrics may take a while.