Fig. 10
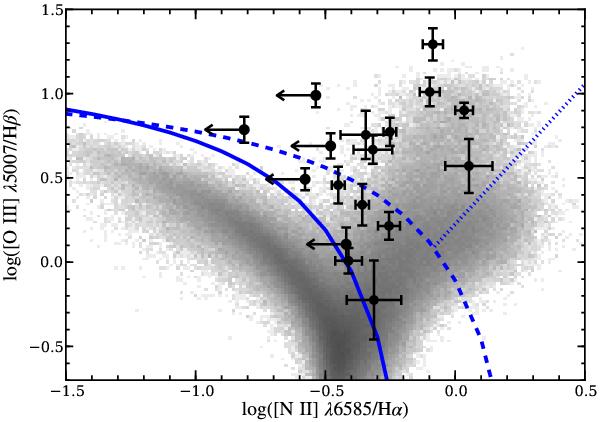
The standard BPT [O iii] λ5007/Hβ vs. [N ii] λ6583/Hα diagram. The 2D histogram of the line ratios for more than 800 000 emission-line galaxies taken from the SDSS DR7 value-added MPA/JHU galaxy catalogue are shown in the grey (logarithmic) scale image. All EELR regions of our sample for which both line ratios could be measured, even if one ratio is just a limit, are plotted as black symbols. Demarcation curves by Kewley et al. (2001), Kauffmann et al. (2003) and Stasińska et al. (2008) are drawn as solid, dashed and dotted blue lines, respectively.
Current usage metrics show cumulative count of Article Views (full-text article views including HTML views, PDF and ePub downloads, according to the available data) and Abstracts Views on Vision4Press platform.
Data correspond to usage on the plateform after 2015. The current usage metrics is available 48-96 hours after online publication and is updated daily on week days.
Initial download of the metrics may take a while.