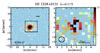
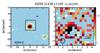
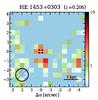
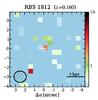
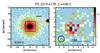
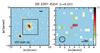
Fig. 8
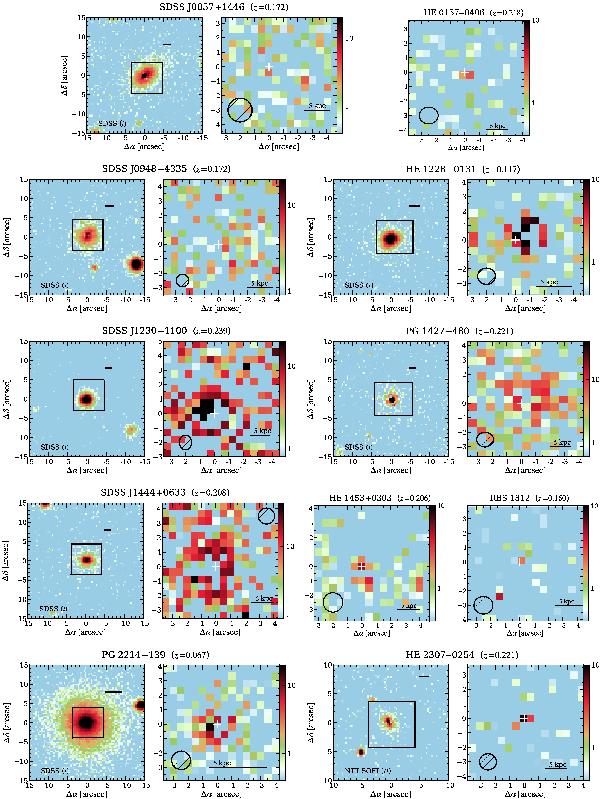
Overview of the individual objects without detected extended emission. For each object the nucleus-subtracted broad-band images is presented, if available, in the left panel with the PMAS FoV indicated by the black rectangle. The black scale bar indicates a physical size of 5 kpc at the redshift of the object. The nucleus-subtracted [O iii] narrow-band images is presented in the right panels with the a white cross indicating the QSO position and the black ellipse indicates again the FWHM of the PSF.


Current usage metrics show cumulative count of Article Views (full-text article views including HTML views, PDF and ePub downloads, according to the available data) and Abstracts Views on Vision4Press platform.
Data correspond to usage on the plateform after 2015. The current usage metrics is available 48-96 hours after online publication and is updated daily on week days.
Initial download of the metrics may take a while.