Fig. 9
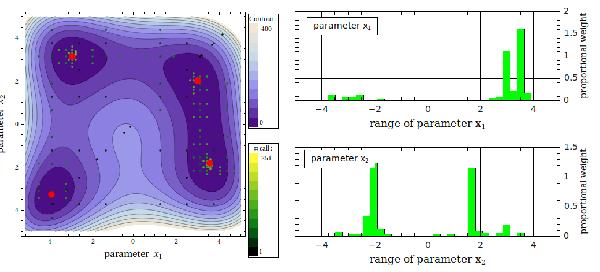
Results for the Himmelblau function using the INS algorithm: Left panel: the distribution of the parameter values after 251 function calls is indicated by green-yellow points, where the dark green points indicate function calls that are made at the beginning of the fit process and light yellow points represent function calls at the end of the fit process. The red dots denote the four minima of the Himmelblau function. Right panel: posterior weights of points after the NS process.
Current usage metrics show cumulative count of Article Views (full-text article views including HTML views, PDF and ePub downloads, according to the available data) and Abstracts Views on Vision4Press platform.
Data correspond to usage on the plateform after 2015. The current usage metrics is available 48-96 hours after online publication and is updated daily on week days.
Initial download of the metrics may take a while.