Fig. 7
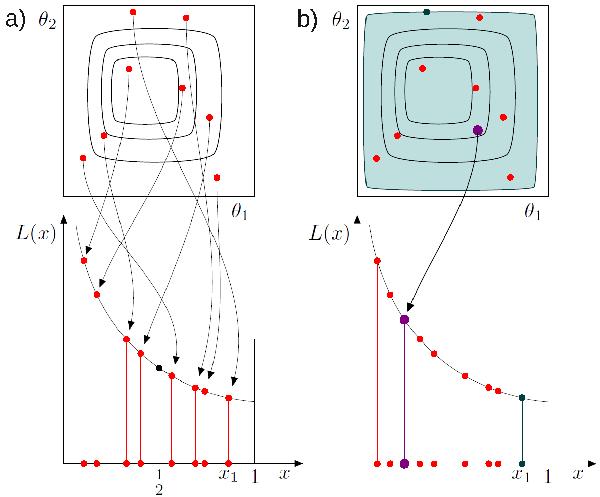
Principle of the NS algorithm (taken from Skilling & MacKay 2012): the upper part of both panels describes a contour plot of a likelihood function ℒ(θ). Left panel: a) each point θ within parameter space ℘ defined by the parameter ranges of θ1 and θ2 is associated with the volume that would be enclosed by the contour L = ℒ(θ). (L(x) is the contour value such that the volume enclosed is x.) If the points θ are uniformly distributed under the prior probability distribution (prior), all these volumes (x-values) are uniformly distributed between 0 and 1. Right panel: b) using a Markov chain method, the NS algorithm takes a point (purple dot) from ℘ satisfying L ≥ L(x1). Inserting the new point into this distribution, we can find the highest x-value x2 used for the next iteration.
Current usage metrics show cumulative count of Article Views (full-text article views including HTML views, PDF and ePub downloads, according to the available data) and Abstracts Views on Vision4Press platform.
Data correspond to usage on the plateform after 2015. The current usage metrics is available 48-96 hours after online publication and is updated daily on week days.
Initial download of the metrics may take a while.