Fig. 2
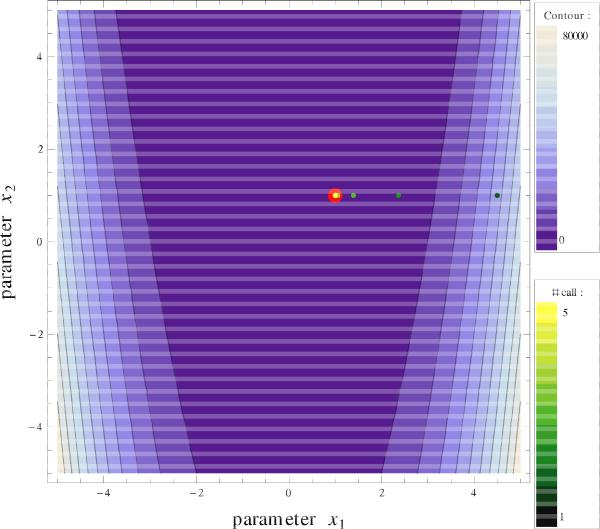
Results for the Rosenbrock function using the LM algorithm with start values x1 = 4.5, x2 = 1.0: the distribution of the parameter values after five function calls (χ2 = 1.38 × 10⁻⁹) is indicated by green-yellow points. The sequence of iterations is color-coded (color bar on the lower right). Early points are denoted in dark green, points toward the end of the iteration are light yellow. The red dot denotes the global minimum of the Rosenbrock function.
Current usage metrics show cumulative count of Article Views (full-text article views including HTML views, PDF and ePub downloads, according to the available data) and Abstracts Views on Vision4Press platform.
Data correspond to usage on the plateform after 2015. The current usage metrics is available 48-96 hours after online publication and is updated daily on week days.
Initial download of the metrics may take a while.