Fig. 1
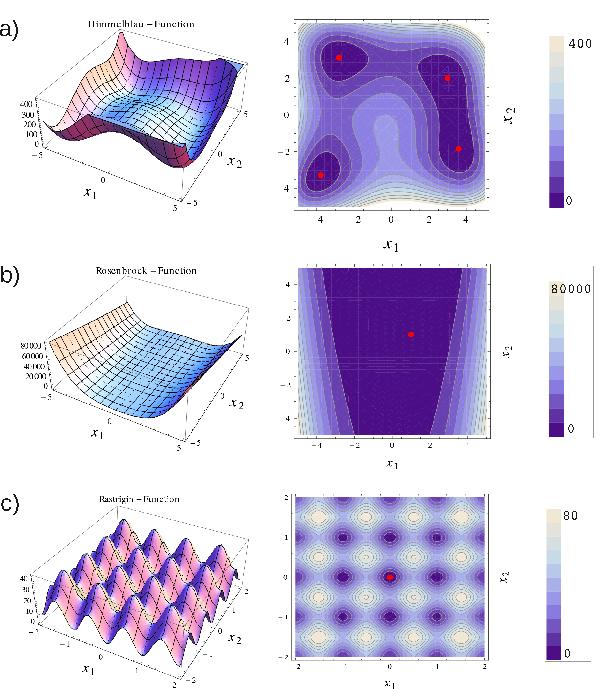
Analytical test functions: a) the Himmelblau function
 has four
identical minima at
f(3.0,2.0) = f(− 2.805118,3.131312) = f(− 3.779310,−3.283186) = f(3.584428,−1.848126) = 0;
b) the Rosenbrock function
has four
identical minima at
f(3.0,2.0) = f(− 2.805118,3.131312) = f(− 3.779310,−3.283186) = f(3.584428,−1.848126) = 0;
b) the Rosenbrock function  has one global
minimum at f(1,1) = 0; c) the Rastrigin
function
has one global
minimum at f(1,1) = 0; c) the Rastrigin
function  has
one global minimum at f(0,0) = 0. The contour plots
of the different test functions are plotted in the second column. The positions of the
global minima for each test function are indicated by red dots.
has
one global minimum at f(0,0) = 0. The contour plots
of the different test functions are plotted in the second column. The positions of the
global minima for each test function are indicated by red dots.
Current usage metrics show cumulative count of Article Views (full-text article views including HTML views, PDF and ePub downloads, according to the available data) and Abstracts Views on Vision4Press platform.
Data correspond to usage on the plateform after 2015. The current usage metrics is available 48-96 hours after online publication and is updated daily on week days.
Initial download of the metrics may take a while.