Fig. 25
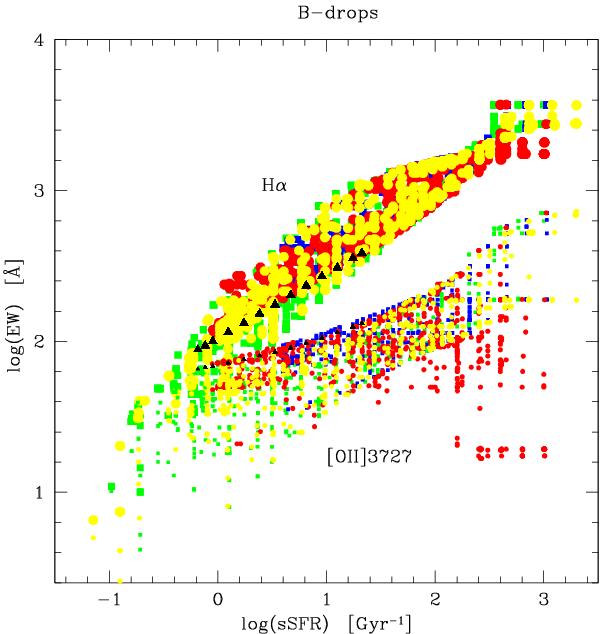
Predicted correlation between the (rest-frame) equivalent width of Hα (large symbols) and the specific star formation rate. The values shown here are derived for the sample of B-drop galaxies. However, all samples and models yield very similar relations. Small symbols show the same for EW([O ii] λ3727), which traces less well the sSFR.
Current usage metrics show cumulative count of Article Views (full-text article views including HTML views, PDF and ePub downloads, according to the available data) and Abstracts Views on Vision4Press platform.
Data correspond to usage on the plateform after 2015. The current usage metrics is available 48-96 hours after online publication and is updated daily on week days.
Initial download of the metrics may take a while.