Fig. 24
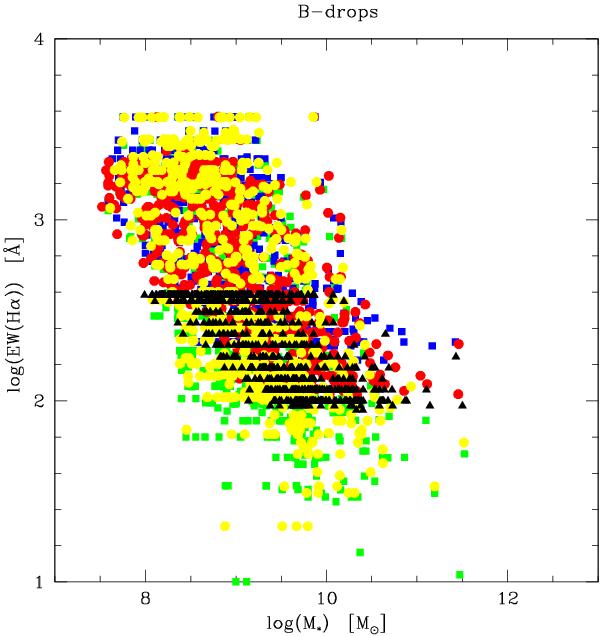
Predicted (rest frame) Hα equivalent width of the B-drop galaxies as a function of the stellar mass. Different colors indicate the different models, as in previous plots. For all SFHs an anti-correlation of WHα with galaxy mass is expected. However, the detailed values of the equivalent width of each galaxy, and the range of WHα covered, are model dependent.
Current usage metrics show cumulative count of Article Views (full-text article views including HTML views, PDF and ePub downloads, according to the available data) and Abstracts Views on Vision4Press platform.
Data correspond to usage on the plateform after 2015. The current usage metrics is available 48-96 hours after online publication and is updated daily on week days.
Initial download of the metrics may take a while.