Fig. 20
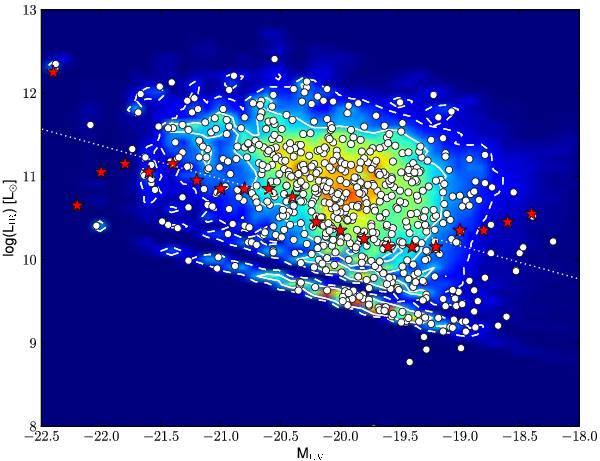
Predicted IR luminosity as a function of the absolute UV magnitude for the B-drop sample (z ~ 4) assuming declining star formation histories (model A). Colors show the full 2D probability distribution function (pdf) of the sample. The solid (dashed) lines encircle the 60 (90)% confidence range. The median values of each galaxy with a median AV ≥ 0.05 are shown as white circles. The median of the pdf in bins of UV magnitude is shown as red stars. The dotted line shows, for comparison, the expected LIR when assuming the standard SFR(UV) and SFR(IR) relations of Kennicutt (1998), and SFR(UV) = SFR(IR).
Current usage metrics show cumulative count of Article Views (full-text article views including HTML views, PDF and ePub downloads, according to the available data) and Abstracts Views on Vision4Press platform.
Data correspond to usage on the plateform after 2015. The current usage metrics is available 48-96 hours after online publication and is updated daily on week days.
Initial download of the metrics may take a while.