Fig. 2
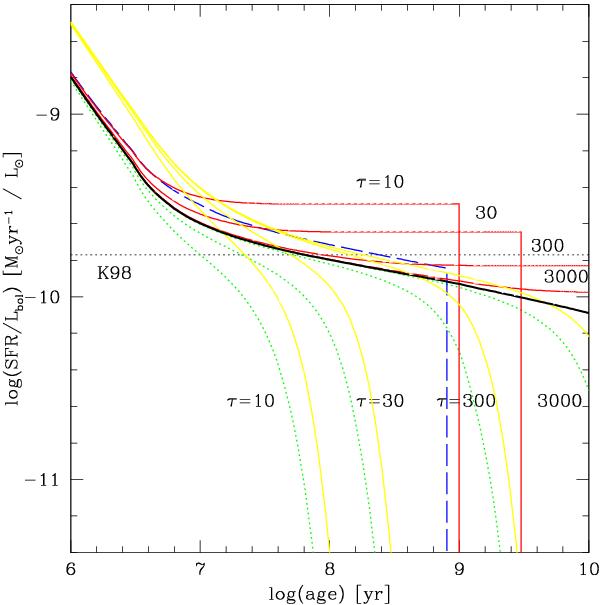
Predicted ratio SFR/Lbol as function of time for the some of the models with exponentially decreasing, delayed, and exponentially rising SFHs (with timescales τ = 10, 30, 300, 3000 Myr indicated), compared to the case of constant SFR. The plots are shown here for BC2003 models with solar metallicity. Same color codes as in Fig. 1. The standard SFR(IR) conversion factor from Kennicutt (1998) is shown by the black dotted line.
Current usage metrics show cumulative count of Article Views (full-text article views including HTML views, PDF and ePub downloads, according to the available data) and Abstracts Views on Vision4Press platform.
Data correspond to usage on the plateform after 2015. The current usage metrics is available 48-96 hours after online publication and is updated daily on week days.
Initial download of the metrics may take a while.