Fig. 19
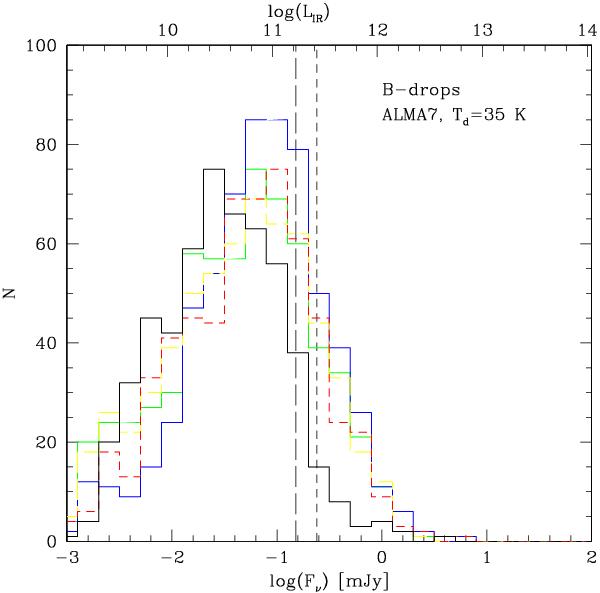
Predicted histogram of median dust continuum fluxes in the ALMA band 7 (0.8–1.1 mm) for the B-drop sample from models assuming different star formation histories. The predictions are plotted for modified black bodies with Td = 35 K and β = 2. Same color coding as in Fig. 22. The vertical lines indicate the continuum sensitivity for an integration time of 60 s with the full array (long dashed), and with 32 antennae available for the ALMA cycle 1 (short dashed). The upper axis indicates the corresponding IR luminosity. Changes of the dust temperature by ± 10 K correspond to a change of the flux by a factor ~2.5−2.8 approximately.
Current usage metrics show cumulative count of Article Views (full-text article views including HTML views, PDF and ePub downloads, according to the available data) and Abstracts Views on Vision4Press platform.
Data correspond to usage on the plateform after 2015. The current usage metrics is available 48-96 hours after online publication and is updated daily on week days.
Initial download of the metrics may take a while.