Fig. 7
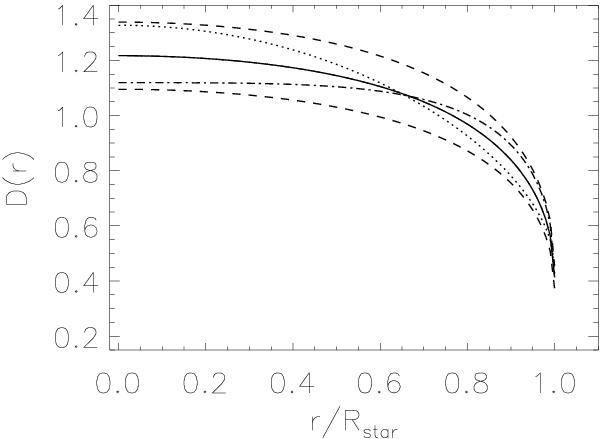
The radial intensity profile D(r/R) as a function of the sky-projected distance r from the stellar centre (R is the stellar radius). As in all calculation in this paper,  . The solid line shows the effect of limb darkening D(r) = LD(u1,u2,μ)/(1 − u1/3 − u2/6) that – multiplied by k2 – is directly proportional to the light loss during a transit. The dashed lines show the tolerable ranges: between these lines the radial intensity distribution profile will produce a radius ratio k that is in the tolerance range of ±5%. The dotted line is an example of an acceptable radial intensity distribution profile with u1 = 0.82,u2 = −0.16, while the dot-dashed line is with u1 = 0.02, u2 = 0.6.
Current usage metrics show cumulative count of Article Views (full-text article views including HTML views, PDF and ePub downloads, according to the available data) and Abstracts Views on Vision4Press platform.
Data correspond to usage on the plateform after 2015. The current usage metrics is available 48-96 hours after online publication and is updated daily on week days.
Initial download of the metrics may take a while.