Fig. 5
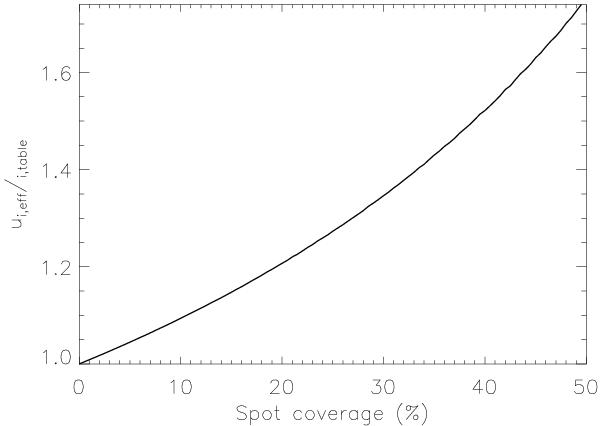
The x-axis is the total spotted area in percentage of the whole stellar surface area. The y-axis is the effective – i.e. observed – limb darkening coefficients relative to the table value at the given stellar efffective temperature. For this figure we used Tstar = 5775 K and Tspots = 3775 K, and the positions of the spots were chosen randomly on the visible hemisphere. The size of the spots were always the same, so higher spot coverage corresponds to larger number of spots. The limb darkening coefficients were taken from Claret & Bloemen (2011) for R-band, log g = 4.5 and at solar metallicity at these temperatures. Effects of faculae were not considered in this figure.
Current usage metrics show cumulative count of Article Views (full-text article views including HTML views, PDF and ePub downloads, according to the available data) and Abstracts Views on Vision4Press platform.
Data correspond to usage on the plateform after 2015. The current usage metrics is available 48-96 hours after online publication and is updated daily on week days.
Initial download of the metrics may take a while.