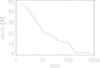
Fig. 3
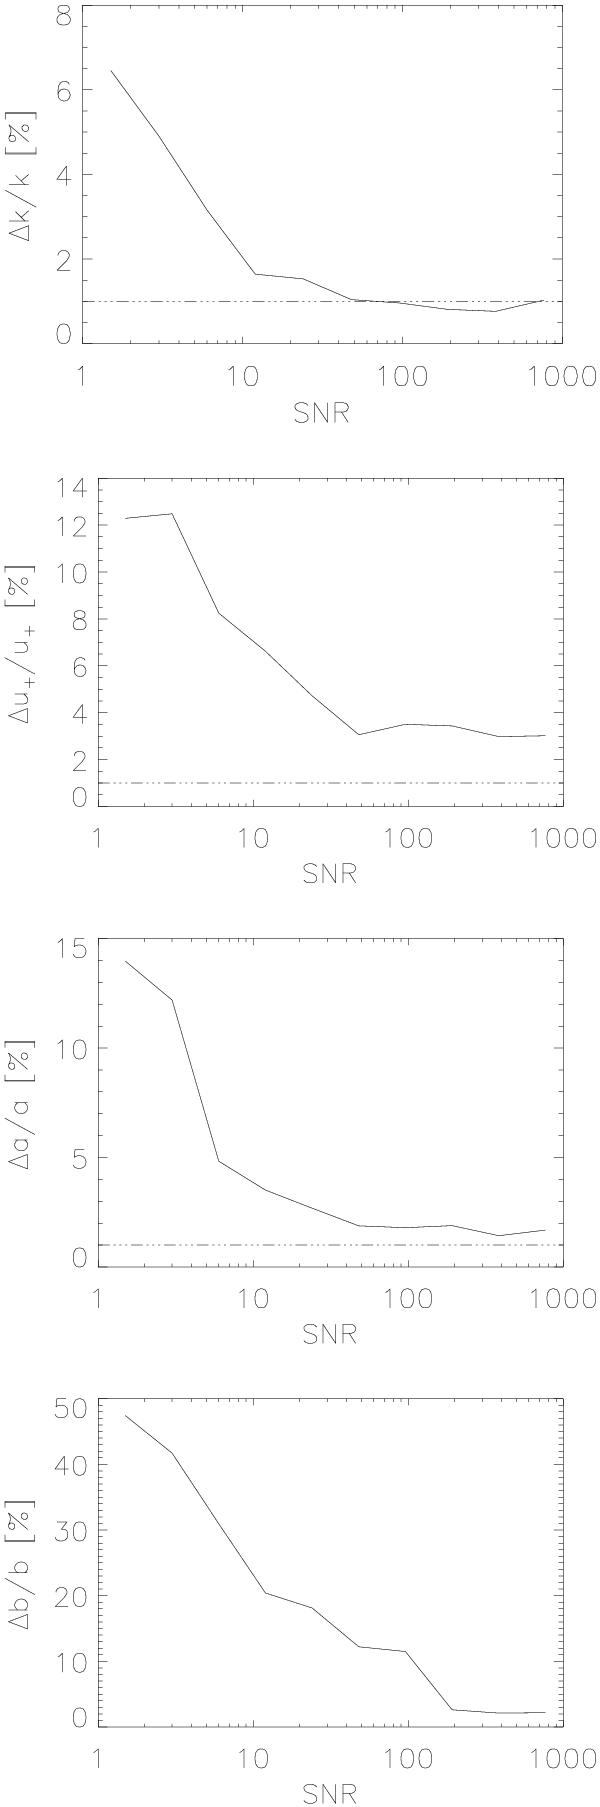
Results of the light curve modelling test. On the x-axis the S/N quantity is defined in the text. y-axes are the relative uncertainties in radius ratio k, u + combination of the two quadratic limb darkening coefficients used, in the scaled semi-major axis (for brevity we used the notation of a only instead of a/Rs in the third panel from top) and in the impact parameter b, from top to bottom, expressed in percentages. The solid lines show the relative uncertainties defined as the standard deviations of the differences of the modelled and the input values normalized to the input values at certain S/N-values.
Current usage metrics show cumulative count of Article Views (full-text article views including HTML views, PDF and ePub downloads, according to the available data) and Abstracts Views on Vision4Press platform.
Data correspond to usage on the plateform after 2015. The current usage metrics is available 48-96 hours after online publication and is updated daily on week days.
Initial download of the metrics may take a while.