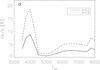
Fig. 2
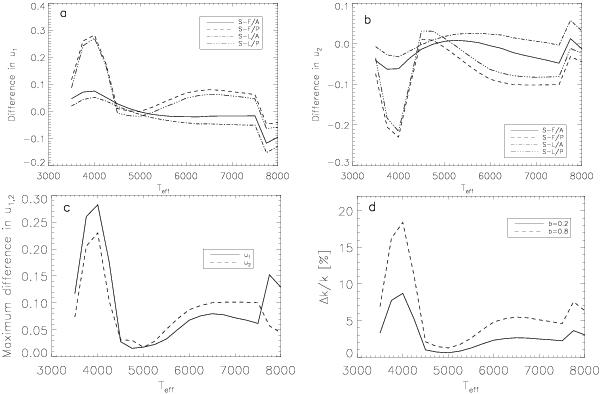
a) The difference of the theoretically predicted limb darkening coefficient u1 as a function of the stellar effective surface temperature between Sing (2010) (S) and different models of Claret & Bloemen (2011). F means the flux conservation method, L means the least square method of Claret & Bloemen (2011). A and P denote the ATLAS and the PHOENIX models that they used for creating of their limb darkening tables. b) The same for the u2 quadratic coefficients. c) The absolute value of the maximum differences at a given temperature between Sing (2010) and some of the Claret & Bloemen (2011) models. The curves in this panel are upper limits, because we calculated the differences between the different limb darkening tables in a conservative way; i.e., we searched for the biggest difference between Sing’s table and any of the Claret & Bloemen’s table at the given temperature. d) Visualization of the meaning of Eq. (1): relative error of the radius ratio of the star and the planet k = Rplanet/Rstar vs. effective surface temperature of the stellar surface when the limb darkening coefficients are fixed. The Δu1, Δu2 uncertainties are taken from panel c). The two curves are valid for a rather central (b = 0.2) and for a rather grazing (b = 0.8) transit. For these plots we used the CoRoT passband limb darkening coefficients of Sing (2010) and Claret & Bloemen (2011), and we assumed log g = 4.50, solar metallicity and a turbulent velocity of 2 km s-1. However, the main result does not change significantly for other input parameters or passbands. The uncertainty of the parameters were estimated as the difference between the two limb darkening tables. In certain temperature regions we are far from the required precision in the radius ratio determination.
Current usage metrics show cumulative count of Article Views (full-text article views including HTML views, PDF and ePub downloads, according to the available data) and Abstracts Views on Vision4Press platform.
Data correspond to usage on the plateform after 2015. The current usage metrics is available 48-96 hours after online publication and is updated daily on week days.
Initial download of the metrics may take a while.