Fig. 1
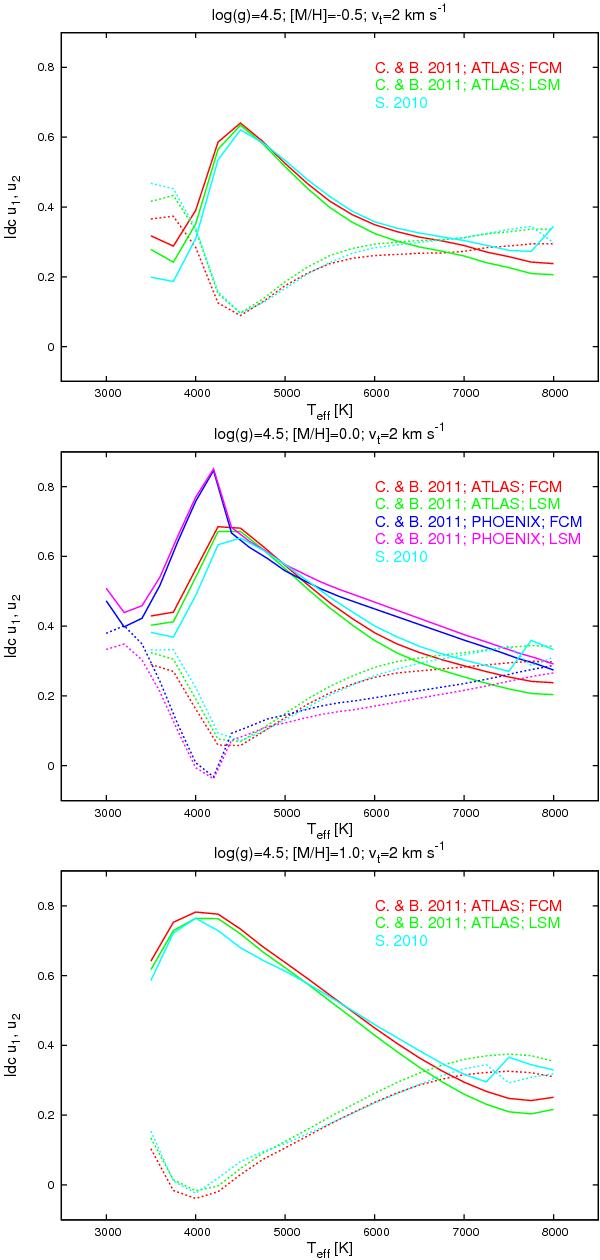
A comparison of 5 (3) different limb darkening models. We plotted only the coefficients of the quadratic limb darkening-law. From top to bottom one can see the models for different metallicities ([M/H] = −0.5,0.0,1.0). For the sake of correct comparison, we used the same logg and turbulent velocity vt values for all the curves. Solid lines represent the u1 coefficients, dotted lines the u2 coefficients. The model of Sing (2010) is denoted by cyan lines. Red lines show the models of Claret & Bloeman (2011), which are based on the ATLAS synthetic spectra and their “flux conservation method” (FCM). Green lines were obtained by them using the same spectra, but applying their “least square method” (LSM) for calculating the limb darkening coefficients. For solar metallicity ([M/H] = 0.0), they also calculated the limb darkening coefficients with these two methods, but from the PHOENIX spectra, too (violet and magenta lines). The figure only hows the CoRoT white light passband coefficients; the discrepancies are similar for Kepler’s response function and for other photometric systems.
Current usage metrics show cumulative count of Article Views (full-text article views including HTML views, PDF and ePub downloads, according to the available data) and Abstracts Views on Vision4Press platform.
Data correspond to usage on the plateform after 2015. The current usage metrics is available 48-96 hours after online publication and is updated daily on week days.
Initial download of the metrics may take a while.