Fig. 6
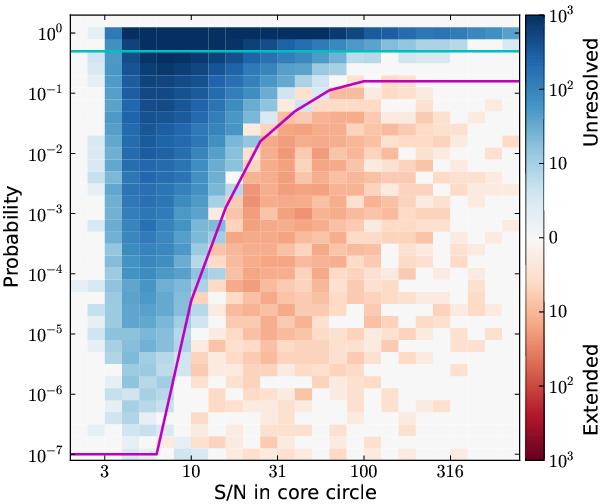
Selection curves in the KS-test probability-S/N plane (magenta solid line). The color–coded grid indicates the absolute value of the number of unresolved minus the number of extended sources. Regions dominated by unresolved sources are depicted in blue, while regions dominated by extended sources are shown in red. The selection curve has been defined as the loci of zeros on the grid. The cyan line refers to a KS-test probability of 50%.
Current usage metrics show cumulative count of Article Views (full-text article views including HTML views, PDF and ePub downloads, according to the available data) and Abstracts Views on Vision4Press platform.
Data correspond to usage on the plateform after 2015. The current usage metrics is available 48-96 hours after online publication and is updated daily on week days.
Initial download of the metrics may take a while.