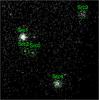
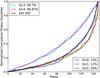
Fig. 4

Left panel: a simulated XRT image with five labeled sources, three AGNs (sources 0, 1, and 2) and two clusters (sources 3 and 4). Right panel: the cumulative net count profile for the sources shown in the upper panel. The KS-test results are given for each source in the inset frame. The two clusters are clearly identified as extended (with a profile above the PSF and a high KS-test probability) and the three AGNs as unresolved sources (with a profile consistent with that of the PSF and a low KS-test probability).
Current usage metrics show cumulative count of Article Views (full-text article views including HTML views, PDF and ePub downloads, according to the available data) and Abstracts Views on Vision4Press platform.
Data correspond to usage on the plateform after 2015. The current usage metrics is available 48-96 hours after online publication and is updated daily on week days.
Initial download of the metrics may take a while.