Fig. 2
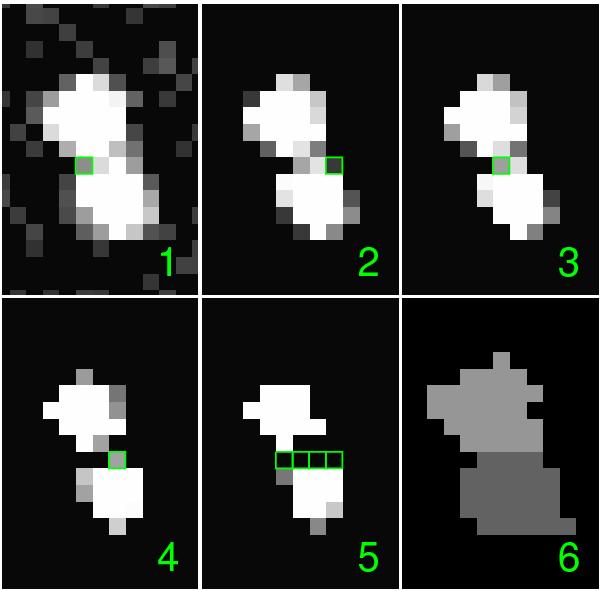
Example of the deblending procedure applied to two unresolved sources spaced by ~6 pixels. In panels 1–5 we show the pixels whose photon density is above a threshold that increases at each step. Bridge pixels (see text for the definition) are marked with green boxes and are identified backwards starting from panel 4 to 1. Panel 6 shows the two sources identified separately, with the bridge pixels re-assigned according to a local criterion.
Current usage metrics show cumulative count of Article Views (full-text article views including HTML views, PDF and ePub downloads, according to the available data) and Abstracts Views on Vision4Press platform.
Data correspond to usage on the plateform after 2015. The current usage metrics is available 48-96 hours after online publication and is updated daily on week days.
Initial download of the metrics may take a while.