Fig. 1
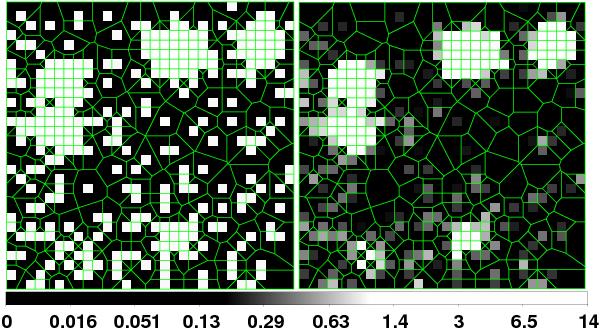
Left panel: original unbinned X-ray image with the Voronoi tessellation (green lines) obtained with the classical sweep-line algorithm. The value of each filled pixel is simply the number of photons. Right panel: photon density map obtained by dividing the original image by the area map. The intensity of each filled pixel is now proportional to the photon density.
Current usage metrics show cumulative count of Article Views (full-text article views including HTML views, PDF and ePub downloads, according to the available data) and Abstracts Views on Vision4Press platform.
Data correspond to usage on the plateform after 2015. The current usage metrics is available 48-96 hours after online publication and is updated daily on week days.
Initial download of the metrics may take a while.