Fig. 7
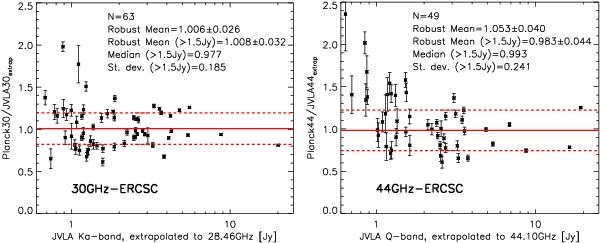
Ratio of Planck-to-JVLA flux densities vs. JVLA flux densities at 30 (left-hand panel) and 44 GHz (right-hand panel). The Planck flux densities used are from the FLUX column of the ERCSC. The JVLA flux densities are extrapolated to the corresponding Planck central frequencies using the 33−43 GHz spectral index measured from the JVLA data. Some sources are excluded from this analysis, due to being extended, confused, or highly variable (see text for details). When multiple observations for a given source are available, these are averaged. Each panel shows the number of sources included, as well as the robust mean, median and standard deviations of the Planck-to-JVLA flux density ratios. To mitigate the effects of Eddington bias, we focus on the >1.5 Jy sources. The solid red lines show the median ratios for these sources, while the dashed red lines show the +/−1 standard deviation range.
Current usage metrics show cumulative count of Article Views (full-text article views including HTML views, PDF and ePub downloads, according to the available data) and Abstracts Views on Vision4Press platform.
Data correspond to usage on the plateform after 2015. The current usage metrics is available 48-96 hours after online publication and is updated daily on week days.
Initial download of the metrics may take a while.